It’s the age of AI and you’ll hear almost everyone talk about it around you. One of the core branches of AI is ML, an acronym for Machine Learning. When we talk about Machine Learning, we can’t not mention Clustering. Clustering refers to the technique of grouping up similar data points into one group/cluster. The backbone of clustering is another concept called “Distance Metrics” and in this article, we are going to discuss the same. We’ll start off with understanding what exactly distance metrics are and then hop on to discussing their types. So without much ado, let’s dive into it.
Machine learning is a dynamic field at the intersection of computer science and statistics, enabling systems to learn patterns from data and make informed decisions. One of the remarkable applications within this realm is vector search, which involves finding similarities between data points represented as vectors in a high-dimensional space. This technique has gained prominence with the advent of vector databases, where vast datasets can be efficiently organized and queried based on vector similarity. Vector search’s ability to handle complex data types like images, text, and audio has revolutionized information retrieval, recommendation systems, and even bioinformatics, underscoring its pivotal role in shaping modern data-driven solutions.
What are Distance Metrics?
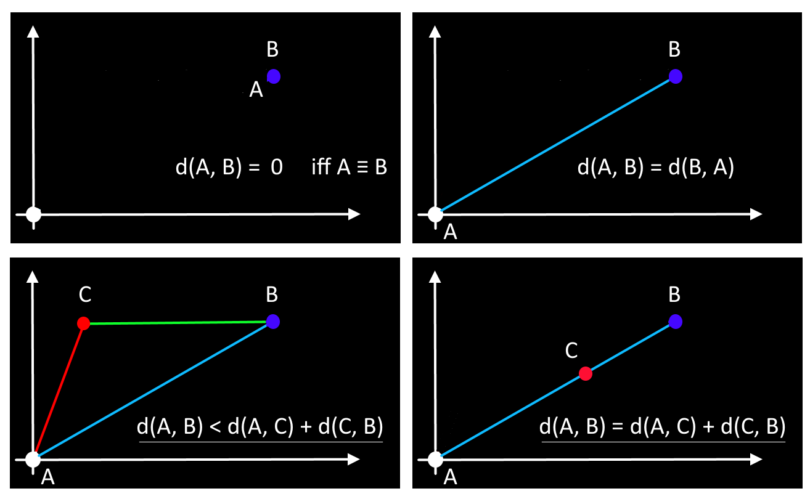
Okay, so what exactly do distance metrics mean? We have established that distance metrics are a key part of clustering algorithms but the question arises – how? Since clustering is all about grouping up similar data points, how can this “similarity” be measured? This is where Distance metrics come into the picture. To calculate the similarity or dissimilarity between data points we compute the distance metric between these two points.
Types of Distance Metrics
Calculation of the distance metric between two data points to account for similarity or dissimilarity between the points, we have numerous approaches and methodologies, and based on these methods we classify distance metrics into various types. Let’s take a look at some of the most prominent classifications of Distance Metrics.
Euclidean Distance
The first classification of Distance Metrics that we are going to discuss is the Euclidean Distance Metrics. It is the Euclidean Distance between two data points that lets us calculate the shortest distance between them. To calculate the Euclidean Distance Metric between two data points we compute the square root of the sum of squares of differences between corresponding elements. This method is based on coordinate geometry. In a coordinate plane, we find out the shortest distance between any two points on the plane by calculating the sum of squares of differences between the corresponding x-coordinates and y-coordinates.
d = ((x2-x1)2 – (y2-y1)2)½
Manhattan Distance
The next Distance metric that we’ll discuss is the Manhattan Distance where we calculate the sum of absolute differences between the data points across all dimensions. The term “absolute difference” means that we consider only the magnitude of the difference computed irrespective of the sign value. This can also be understood as the difference which is always computed by subtracting the smaller value from the greater value. Manhattan Distance is also known as city block distance. The whole idea behind computing the Manhattan Distance Metric is to compute the distance between two data points measured along axes at right angles. Let’s have a look at the mathematical representation of the formula used to calculate the Manhattan Distance Metric.
d = |x2-x1| – |y2-y1|
Minkowski Distance
Sometimes data scientists want to find a middle ground between using the Euclidean Distance Metric and the Manhattan Distance Metric. For these cases, we use the Minkowski Distance. Computing the Minkowski Distance Metric is really helpful when we need to find the optimal correlation or classification of data. Not just this, Minkowski distance is also used in certain algorithms like K-Nearest Neighbors, Learning Vector Quantization (LVQ), Self-Organizing Map (SOM), and K-Means Clustering.
The Minkowski distance can also be viewed as a multiple of the power mean of the component-wise differences between V1 and V2. Where V1 and V2 are both vector database. Here’s the mathematical representation of the formula used to calculate the Minkowski Distance Metric.
X = (x1 , x2 , x3 , … , xn)
Y = (y1 , y2 , y3 , … , yn)
D(X, Y) = (i=1n|xi-yi|p)1/p
Hamming Distance
We’ll now have a look at the last method we have to calculate a distance metric between two data points in machine learning, which is the Hamming DIstance Metric. Hamming Distance measures the similarity between two strings of the same length. The Hamming Distance between two strings of the same length is the number of positions at which the corresponding characters are different. The characters can be letters, bits, or decimal digits, among other possibilities. To understand this whole hamming distance talk better, let’s look at some examples.
- Hamming distance for “karolin” and “kathrin” is 3.
- Hamming distance for “karolin” and “kerstin” is 3.
- Hamming distance for “kathrin” and “kerstin” is 4.
- Hamming distance for 0000 and 1111 is 4.
- Hamming distance for 2173896 and 2233796 is 3.


Leave a Comment
You must be logged in to post a comment.